The Climate Resilience Research Agenda (CRRA) for the Philadelphia Region
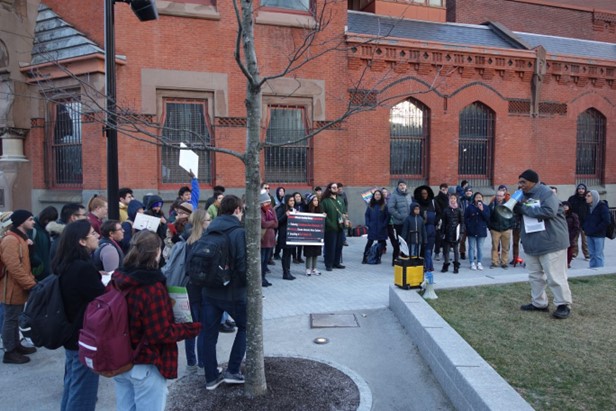 A 2/28/20 Climate Rally attended by students, faculty, and NGOs held on the campus of Drexel University
The Climate Resilience Research Agenda (CRRA) was developed through a collaboration formed in 2019 between the City of Philadelphia, the Delaware Valley Regional Planning Commission (DVRPC), the Academy of Natural Sciences (ANS) of Drexel University and Drexel University faculty and staff engaged in the Consortium for Climate Risks in the Urban Northeast (CCRUN).
In that year, Drexel undergraduate students had petitioned the University to take more institutional action on climate change. They organized a Climate Rally attended by students, faculty, and representatives of several NGOs, and obtained over 2000 signatures in support of a student-led proposal to form a Sustainability Office on campus. Though the COVID-19 pandemic soon closed campus, Drexel’s leadership responded by declaring 2021 “Climate Year,” and committing the university to acceleration of its climate-focused research, civic engagement, and collaboration throughout the city and region.
In recognition of this institutional commitment, Drexel was invited to join the University Climate Change Coalition (UC3), an alliance of more than 20 leading research universities working to build resilience to climate change in their communities. One requirement of UC3 members is that they convene local stakeholders to discuss the climate risks facing the region.
To plan its convening, Drexel took a collaborative, outward-looking approach, reaching out to the partners listed above, each of which was independently engaged in climate initiatives in the Philadelphia region. A Planning Team was formed including:
- Franco Montalto and Korin Tangtrakul, Drexel University and CCRUN
- Hugh Johnson and Jennifer Britton, Drexel University
- Richard Johnson, Alexis Schulman and Roland Wall, ANS
- Saleem Chapman and Matina Granieri, City of Philadelphia Office of Sustainability
- Julia Rockwell, Philadelphia Water Department
- Chris Linn, Robert Graff and Miles Owen, DVRPC
- Ariella Maron, LION Advisors
Together, the Planning Team recruited a much larger team that, through four Working Groups, developed the research needs articulated in this document. The Climate Resilience Research Agenda (CRRA) is a co-produced preliminary list of research activities that, if undertaken, could help to make the Philadelphia region1 more resilient to climate change. Rather than a traditional focus on climate mitigation or climate adaptation, Working Group members deliberated more broadly about how climate action could be integrated into decisions, policies, and strategies that could collectively make the region more resilient to climate change, a field that the Intergovernmental Panel on Climate Change describes as Climate Resilient Development.
The research activities listed in this document constitute a first step in what must become an ongoing, inclusive public discussion regarding how this region will address the challenges of climate change. The intended audience is much more than a group of traditional academic researchers. Rather, the hope is that the needs articulated herein will provide important context for decision-makers and policymakers, practitioners, philanthropic organizations, community-based organizations, and others as they incrementally work to make the region more climate resilient. The Planning Team invites all who read this document to become part of this process.
1The CRRA Planning Team acknowledges that the entire Philadelphia region is located on Lenapehoking, the traditional land of the Lenni-Lenape tribal nation, most of whom were forcibly removed over the last few centuries. We recognize the Lenni-Lenape as the original people of this land and their continuing relationship with their territory. In our acknowledgement of the continued presence of the Lenape people in their homeland, we affirm the aspiration of the great Lenape Chief Tamanend, that there be harmony between the indigenous people of this land and the descendants of the immigrants to this land, ‘as long as the rivers and creeks flow, and the sun, moon, and stars shine.’
Increased Precipitation
Philadelphia is getting wetter through increased precipitation. Over the past 82 years, annual average precipitation has increased at a rate of 0.82 inches per decade. In the observed record at Philadelphia International Airport, 6 of the 10 wettest years on record have occurred since 1990. While mean annual precipitation levels increased over the past century, year-to-year (and multi-year) variability of precipitation has also become more pronounced. The standard deviation, a measure of variability, increase from 6.1 inches for the 1941 - 1981 period, to 8.3 inches for the 1982 - 2022 period.
Mean annual precipitation is projected to increase 5 to 12 percent by the 2050s and 8 to 16 percent by the 2080s. Of more concern, but harder to predict, the frequency and intensity of precipitation events (such as hurricanes, Nor’easters, cloud bursts, and cyclones) is also increasing, causing more intense pluvial and fluvial flooding. For example, Hurricane Isaias struck Southwest Philadelphia in August 2020, covering large portions of the Eastwick community in upwards of four feet of water in a matter of minutes2. In September 2021, remnants of Hurricane Ida caused unprecedented flooding of the Vine Street Expressway due to the swelling of the Schuylkill River3.
Table 1: CCRUN Precipitation Projections for the Philadelphia Region based on CMIP6. Projections are based on 35 GCMs and 2 SSPs. Shown are the low-estimate (10th percentile), middle range (25th to 75th percentile), and the high-estimate (90th percentile). Baseline data are for the 1981 to 2010 and are from the NOAA National Climatic Data Center (NCDC)
|
Decade
|
Low Estimate
(10th Percentile)
|
Middle Range
(25th to 75th Percentile) |
High Estimate
(90th Percentile)
|
2030s
|
0 percent
|
+2 percent to +8 percent
|
+10 percent
|
2040s
|
+1 percent
|
+4 percent to +10 percent
|
+13 percent
|
2050s
|
+2 percent
|
+5 percent to +12 percent
|
+14 percent
|
2060s
|
+2 percent
|
+5 percent to +13 percent
|
+17 percent
|
2070s
|
+3 percent
|
+7 percent to +14 percent
|
+18 percent
|
2080s
|
+3 percent
|
+8 percent to +16 percent
|
+21 percent
|
2100
|
-2 percent
|
+6 percent to +22 percent
|
+30 percent
|
2WHYY, “Isaias emergency: Eastwick residents call for city, state aid after ‘devastating’ flooding”. whyy.org/articles/isaias-emergency-eastwick-residents-call-for-city-state-aid-after-devastating-flooding/
3WHYY, “Why Ida’s remnants left the Vine Street Expressway under water”. whyy.org/articles/hurricane-ida-flooding-vine-street-expressway-infrastructure/
Download table data
Rising River and Sea Level
River and sea levels are rising. Observations indicate that the tidal Delaware River rose at the rate of about 1.2 inches (0.3 meters) per decade over the last century (Figure 2). Sea level is projected to rise in Philadelphia by 7 to 11 inches by the 2030s, 14 to 19 inches by the 2050s, and 24 to 38 inches by the 2080s. The high-end estimate for sea level rise by the 2080s is 45 inches. By 2100, sea levels are projected to rise by as much as 64 inches. Sea level rise alone is increasing the number of days that Philadelphia experiences high tide—or sunny day--flooding (flooding due to tide levels in the absence of a storm). Coupled with storm surges, sea level rise is causing an increased frequency of coastal flooding, which is exacerbated further when accompanied by heavy precipitation events. As the sea level in the Delaware River Estuary continues to rise, it will also push salty and brackish water upriver causing impacts to ecosystems and water treatment facilities designed to only accommodate fresh water.
Figure 2: Source National Oceanic and Atmospheric Administration, Tides and Currents
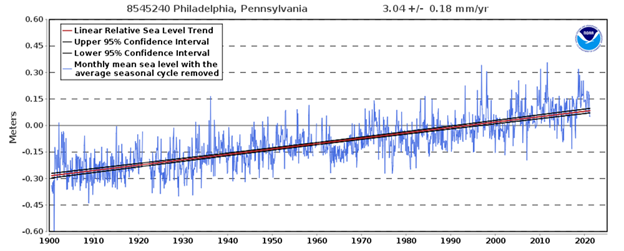
Table 2: CCRUN Sea Level Rise Projections for the Philadelphia Region based on CMIP6 Projections for future sea level rise are derived from the IPCC's 6th Assessment Report. Projections are relative to the 1995 to 2014 based period. See et Fox-Kemper al., 2021 for a full description of the methods.
Decade 10th Percentile 25th Percentile 50th Percentile 75th Percentile 90th Percentile
|
Decade
|
10th Percentile
|
25th Percentile
|
50th Percentile
|
75th Percentile
|
90th Percentile
|
2030s
|
6 in. |
7 in. |
9 in. |
11 in. |
13 in. |
2050s
|
12 in. |
14 in. |
16 in. |
19 in. |
23 in. |
2080s
|
21 in. |
24 in. |
29 in. |
38 in. |
45 in. |
2100
|
25 in. |
29 in. |
36 in. |
50 in. |
64 in. |
2150
|
38 in. |
47 in. |
58 in. |
88 in. |
177 in. |
Download table data
Increased Air Temperature
Philadelphia is also getting hotter. Over the past 82 years, annual average temperature has increased at a rate of 0.43 °F per decade. In the observed record at Philadelphia International Airport, 8 of the 10 hottest years on record have occurred since 2000.
Looking at extreme events, 7 of the 10 years with the most days at or above 90 degrees in the 83-year record have occurred since 1990. However, it is important to note that the number of events in any given year is highly variable and the long-term trends (1941 to present) for these heat events cannot be distinguished statistically from random variability.
In the near future, mean annual temperatures are projected to increase by 4.1 to 5.8 degrees F by the 2050s and by 5.5 to 9.4 by the 2080s. In addition to mean temperatures increasing, the frequency and intensity of hot days and heat waves is also projected to increase. By the 2050s, the numbers of days with maximum temperatures at or above 95 F (currently experienced on average 6 days per year) is projected to range from 21 to 34 days per year and by the 2080s, 34 to 72 days per year. The frequency of heat waves, defined as three or more consecutive days with maximum temperatures at or above 90 °F, may triple by the end of the century, from 3 events per year in the current climate to 9 events per year in the future.
Table 3: CCRUN Air Temperature Projections for the Philadelphia Region based on CMIP6. Projections are based on 35GCMs and 2 SSPs. Shown are the low-estimate (10th percentile), middle range (25th to 75th percentile), and the high-estimate (90th percentile). Baseline data are for the 1981 to 2010 base period and are from the NOAA National Climatic Data Center (NCDC).
|
Decade
|
Low Estimate
(10th Percentile)
|
Middle Range
(25th to 75th Percentile)
|
High Estimate
(90th Percentile)
|
2030s
|
+1.9°F |
+2.7°F to +3.9°F |
+4.7°F |
2040s
|
+2.6°F |
+3.3°F to +4.9°F |
+5.9°F |
2050s
|
+3.0°F |
+4.1°F to +5.8°F |
+6.8°F |
2060s
|
+3.6°F |
+4.7°F to +6.9°F |
+8.5°F |
2070s
|
+4.0°F |
+5.3°F to +8.0°F |
+9.8°F |
2080s
|
+4.7°F |
+5.5°F to +9.4°F |
+11.1°F |
2100
|
+4.9°F |
+6.0°F to +10.5°F |
+12.9°F |
Download table data
Table 4: CCRUN Climate Projections for the Philadelphia Region based on CMIP6. Projections are based on 16GCMs and 2 SSPs. Baseline data are for the 1981 to 2010 base period and are from the NOAA National Climatic Data Center (NCDC). Shown are the low-estimate (10th percentile), middle range (25th to 75th percentile), and high-estimate (90th percentile) 30-year mean values from model-based outcomes. Decimal places are shown for values less than 1, although this does not indicate higher precision/certainty.
|
Extreme Event
|
Baseline
|
2030s
|
2050s
|
2080s
|
|
# of days/year with maximum temperature at or above:
90°F
95°F
|
27
6 |
37 (47 to 56) 67
11 (17 to 21) 27 |
43 (56 to 72) 84
17 (21 to 34) 51 |
63 (72 to 102) 117
27 (34 to 72) 88 |
# of heat waves/year
Average length of heat waves (in days)
|
3
5 |
5 (5 to 6)
5 (6 to 7) 8 |
6 (7 to 9) 9
9 (9 to 9) 9 |
5 (6 to 7) 9
6 (7 to 10) 12 |
| # of days/year with minimum temperature at or below 32°F
|
84 |
45 (57 to 70) 70 |
23 (45 to 63) 63 |
2 (10 to 50) 57 |
# of days per year with rainfall exceeding
1 inch
2 inches
4 inches
|
11
2
0.2 |
10 (11 to 12) 12
2 (2 to 2) 3
0.2 (0.2 to 0.2) 0.2 |
11 (11 to 13) 13
2 (2 to 3) 3
0.2 (0.2 to 0.3) 0.3 |
11 (12 to 14) 14
2 (2 to 3) 4
0.2 (0.2 to 0.3) 0.3 |
Download table data
1. Regional Climate Change and Cascading Hazards
Working Group 1, co-led by Kermit O and Daniel Bader, identified a set of recommended research agenda items pertaining to the following themes: water, health impacts, ecosystems and green infrastructure, and the built environment. Their specific research agenda items can be found in the CRRA report
on page 19.
2. Health and Environment Vulnerability
Working Group 2, co-led by Julie Uleich and Dr. Katera Moore, organized their set of recommended research agenda items around the following key themes: identifying vulnerabilities, assessing impacts, questions for identifying data needs, and prioritizing solutions. Working Group 2’s specific research agenda items can be found in the CRRA report on page 21.
3. Built Environment and Infrastructure System Resilience, and Decarbonization/Electrification of the Energy Sector (originally titled “Planning Low-Carbon Adaptation of the Built Environment”)*
Working Group 3, co-led by Dr. Jin Wen and Steven Krug, identified a list of recommended research activities across the following themes: energy infrastructure resilience, temperature and water resilience, and decarbonization and electrification of the energy sector. Specific research agenda items for this Working Group can be found on page 25 of the CRRA report.
* This Working Group name was later changed to better align with the group’s identified themes and research agenda items.
4. Regional Climate Governance and Adaptive Management
Working Group 4, co-led by Dr. Christina Rosan and Charles Ellison, organized their identified recommended research agenda items around the following themes: racial justice and inclusion, governance and policy, and knowledge to action. Working Group 4’s specific research agenda items can be found in the CRRA report on page 28.
For more information on CRRA, please reach out to swre@drexel.edu.